
Working with data is the hardest part of AI. We know this first hand and we re-learned it while doing a few customer projects where we needed to connect data sets together. So we built our auto-join feature, which we will continue to improve in future releases as we work to make AI easy for developers of all skill levels.
This minimal example involves just two data sets and three columns--of course, Featrix can scale up to far more than three columns!
Automatically Joining AI Data Sets with Featrix
When we're building machine learning models, we often want to bring data together from different sources: different tables, different CSV files, or even completely different databases. Typically, information from these different sources is encoded slightly differently.
Bringing together these sources is often challenging: it tends to involve manual scripts, SQL trial and error, and tedious debugging. The work we are doing with Featrix not only makes this much easier, but improves model accuracy as well.
There are several papers about improving model accuracy. One of the leading ways is to bring new data to a model. Creating AI training data sets from multiple sources of data is a powerful way to improve your learning model. This makes intuitive sense: Adding more data provides the model more context to draw from.
In this demo, we show how to use Featrix to automatically join data from multiple sources so that you can make predictions that span the data sources without having to join the data yourself.
In other words, Featrix provides the ability to make a prediction on a variable in one source based on data from another source!
This is powerful. Consider data from two different applications or departments. For example, data may originate from sales and marketing, and each data source has its own representations for business data, which makes it expensive to join the data manually. But your boss probably doesn’t care about that: You need results.
We’re building an easy button for this kind of task.
In our toy example, we've got data about the heights and weights of cats and dogs. As shown in the plot below, the combination of heights and weights shows no discernible clustering. The data is mixed.
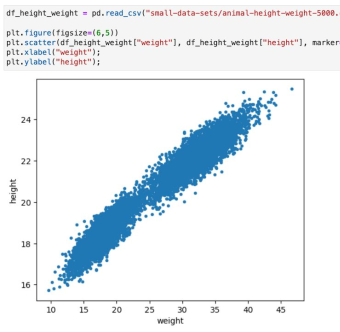
To predict whether an animal is a cat or a dog requires knowing something about both the height and the weight.
In our first data set, we have height and weight data. Note that there's nothing about what type of animal is involved:
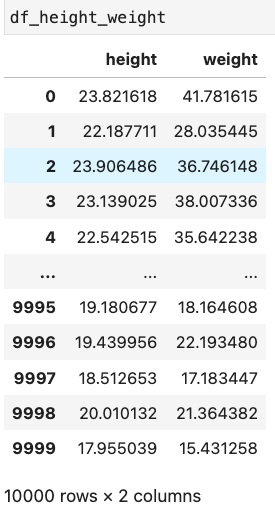
In our second data set, we have data for the heights and type of animal:
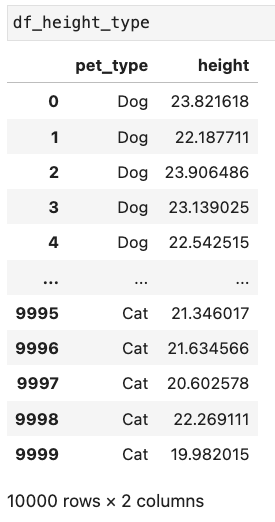
Note that pet_type = “Dog” or “Cat.”
Training the Embedding Space
We're going to bring these two data frames together into a single vector space. To do this, we will train a network that represents the vector on these two data sets. Generally, we would split our available data into train and test sets, so we could validate the results. We do the split here, but for the sake of brevity, we aren't going to use the test data in this demo.
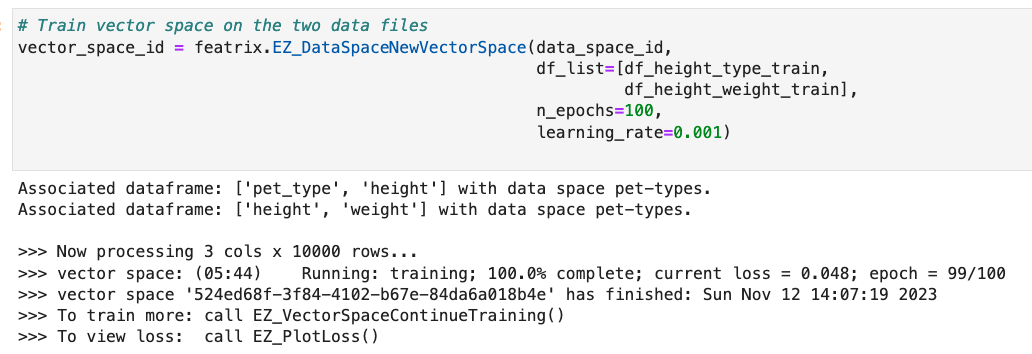
Now we've got embeddings in this vector space: pet_type, height, and weight.
Visualizing the Embedding Space
We can look at the relationship between the embeddings for the type of pet and for the height. What we see here is that the embeddings for Cat and the embeddings for animals 20 inches and under are similar.
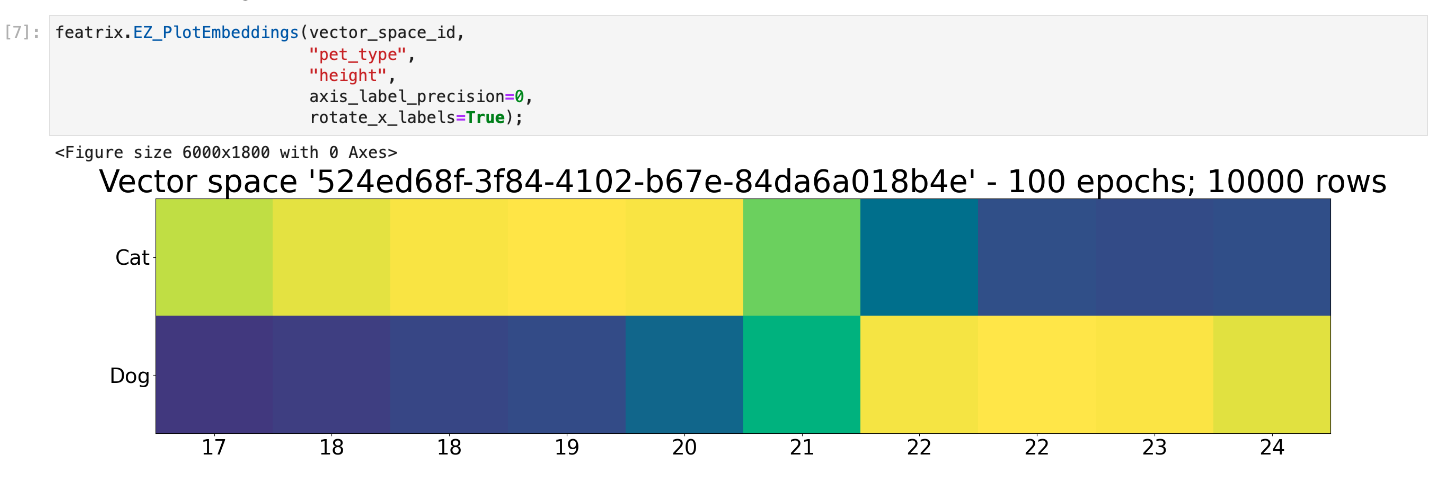

We also see there’s a little bit of fuzziness when an animal is 20 to 21 inches tall where the embeddings start to be more similar to Dog.
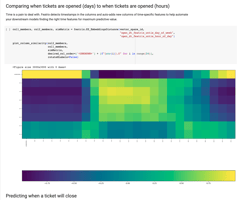
We can do this same comparison between the embeddings for the weights and the pet type as well. Let’s take a look:
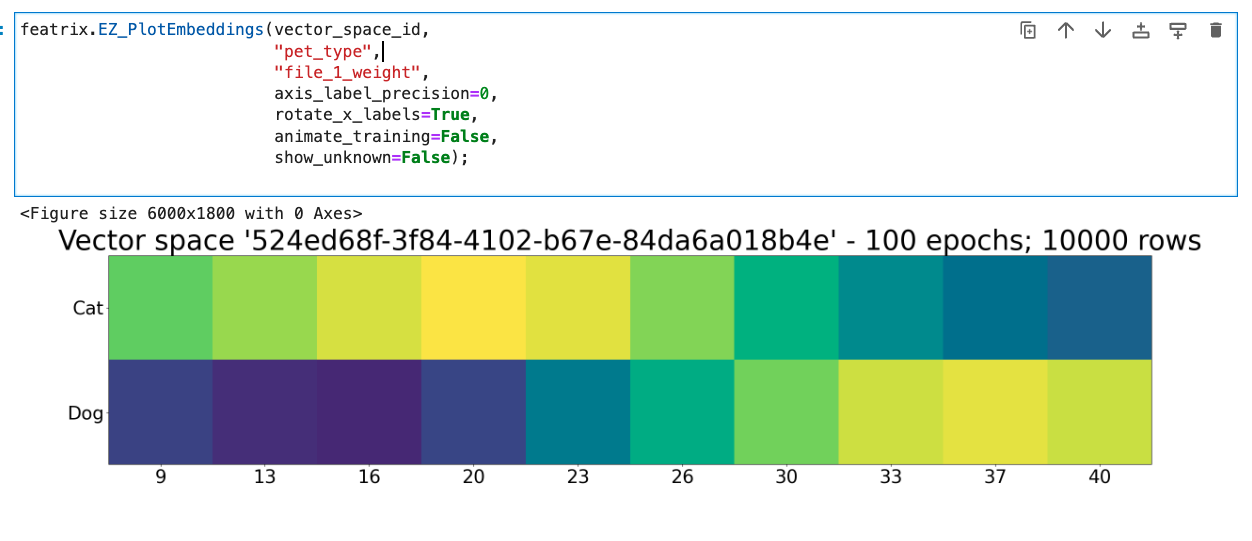 Under the hood, our function PlotEmbeddings samples the domain of the variables specified, and then it constructs the embeddings for just those variables.
Here we specify pet_type and height, so we construct embeddings for just the set of pet_type values and just height values. Next, we take these vectors, multiply the first one by the transpose of the second, and that gives us their cosine similarity as a matrix, which is what these plots show. The structure of these embeddings comes from the training of the vector space we did above—and it is that structure that gives the embeddings their semantics and lets us compare them in a meaningful way.
At this point, we've traversed across the two data sets. We have height and weight from one data set and the pet type and height in the other data set.
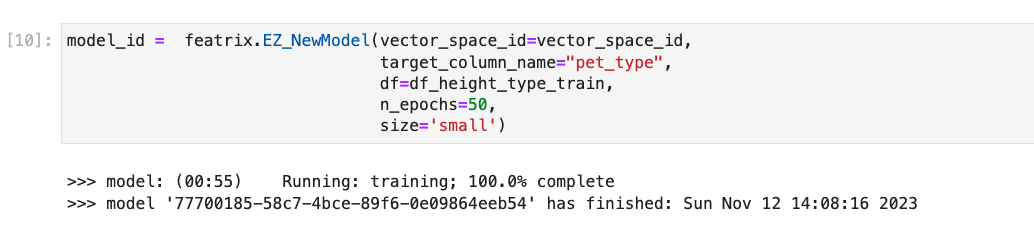
We have our embedding space and now we can build a simple model that leverages the structure of this space.
Our model will predict the type of animal from the weight. The pet_type is our target column, and we train the model on the data set that contains the pet_type and height – but the model is not trained on the weight data at all.
This is a simple neural network—it just has two layers and it trains quickly.
Now we can use the model to make predictions!
To test the model, let’s ask the model about weights from 10 to 50 lbs at 5 lb increments. First, we set up the list of queries we want to make. We can run multiple questions at once with multiple variables or just a single variable. Here we just specify the weight.
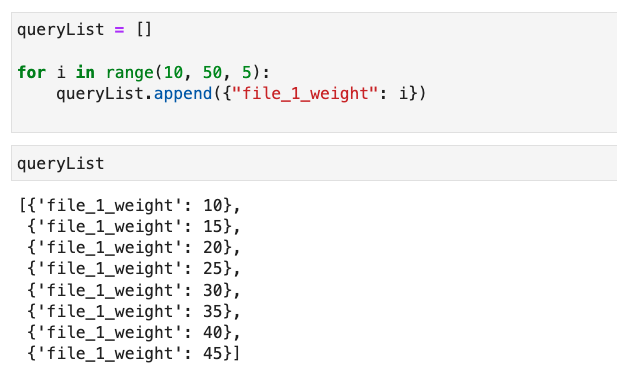
Note that we could also go back and use our test data from the original data set.
Now we run the query and print out the results:
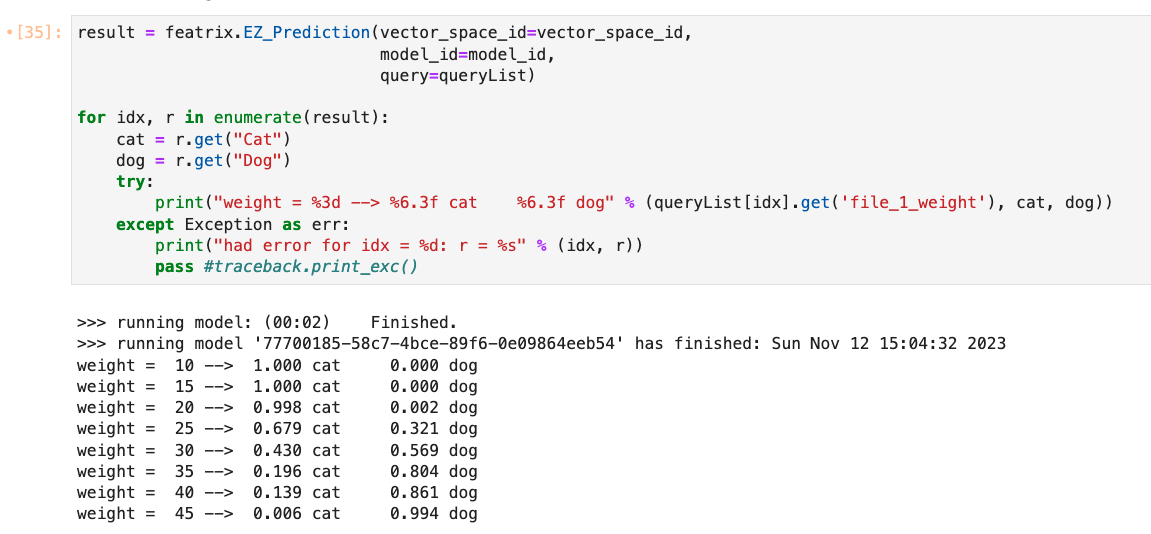
You can see as we move up through the range of weights, we start predicting a higher chance of the animal being a dog.
Power and Ease
What we’ve done is train a vector space on multiple data sets and then train a simple model to leverage the structure of that vector space to answer a question that spans multiple data sets. We didn’t need all the data to build the model, nor did we need a particularly complex model to leverage this power!
This simple demo shows just a sliver of the power of Featrix. Featrix supports joining data in this manner across more than just two data sets: we have done projects involving numerous sources of data spanning hundreds of columns. For beefier examples that you can tinker with, check out our live demos.
Also, be sure to check out our posts about adding new data sets and the challenges of data fusion.
Q&A
-
How does Featrix handle discrepancies in data representation across different sources?
There are different types of discrepancies that can appear in data, and often we don't even need multiple data sources to have discrepancies. Regardless of whether you are working with one data source or several, Featrix deals with discrepancies in a few ways. First, Featrix uses a variety of privately hosted LLM models to enrich and characterize data in a few ways. Featrix also leverages information theory principles (e.g., relative entropy and mutual information, among other things) as part of the deep learning process when Featrix creates its foundational model, which is an embedding space that is private to your data. Through these techniques, Featrix is robust to noise, such as nulls in the data, or multiple labels that refer to the same entity. -
What are the limitations of Featrix when it comes to joining extremely large datasets or those with complex relationships?
We are growing our capabilities all the time as we mature the product and its features. The tradeoff is always about cost: with our usage-based pricing, you can train larger models, but most applications don't benefit beyond a statistically meaningful sample, which tends to be much smaller than the original data. Complex relationships are always exciting and Featrix continues to mature the product. If you have a specific concern, please email us at hello@featrix.ai or schedule a meeting. -
Can Featrix integrate real-time data from streaming sources, or is it limited to static datasets like CSV files and databases?
We see more and more customers working with event streams and event-driven data in general. We provide a "feeds" API that lets you stream event data to Featrix for integrating into an updated model trained or fine tuned in the future once enough events are coming in. We have designed this API to handle about 100,000 events an hour. If you need more throughput, we can certainly offer that. -
What kind of model accuracy improvements can users typically expect when incorporating Featrix into their machine learning workflows?
We view the accuracy question in terms of efficiency: we enable a developer new to AI to get near topline accuracy with about 15 lines of code and no data preparation. With intricate knowledge of the data and many years of experience, hand crafted models may perform better, but they also take a lot more than 15 lines of code to train. Our goal is to enable you to bring together more data than before to boost your accuracy--over the long term, accuracy comes from the data, rather than deep model tuning. -
How does Featrix ensure the privacy and security of data, especially when joining datasets from different applications or departments that may have sensitive information?
We are regularly evaluating our security posture, but in general we use best practices from authentication down to data storage. Usually deeply personal and identifying data is not going to be key to your models performance, but if you have regulated or high sensitive data, we can integrate with your storage cloud or deliver Featrix for use in private clouds.